
What the middle of the peloton is worth, measured
Cycling has long put the benefit of drafting at somewhere between a third and a half. A study simulating two 121-rider pelotons at nearly three billion cells apiece, checked against four wind-tunnel tests, found that deep inside a packed bunch the figure is not a third. It is a twentieth.
Everyone who has ridden in a group knows that sitting behind someone is easier. The question is how much easier, and for most of the sport’s modern history the answer has come from studies of small lines of riders, which put a trailing rider’s drag at somewhere between 50 and 70 per cent of an isolated rider’s at the same speed.
Those numbers went into the mathematical models of cycling performance, and from there into how the sport talks about itself. A 2018 study set out to check whether they survive contact with an actual bunch.
What was done
Two pelotons of 121 cyclists were simulated using computational fluid dynamics, solving the RANS equations with the Transition SST k-ω turbulence model. The mesh was fine: a cell size of 20 μm immediately adjacent to each rider’s body, and a total of nearly three billion cells per peloton. The simulations were then validated against four wind-tunnel tests, one of which used a peloton of 121 physical models.
Reference The two 121-cyclist pelotons, the RANS and Transition SST k-ω method, the 20 μm wall-adjacent cell size, the near-three-billion cell count and the four validating wind-tunnel tests, from the paper’s abstract.
The validation is worth dwelling on, because it is the part that gives the headline number its weight. For an isolated cyclist, the wind tunnel measured 40.36 N of drag and the simulation produced 40.33 N — a difference of under one per cent. For riders in small sub-configurations, agreement was within a few per cent for the leading riders, with the largest deviations, up to 13.6 per cent, on the last rider in each group.
Reference The isolated-cyclist figures of 40.36 N measured against 40.33 N simulated, and the per-rider deviations for the sub-configurations including the largest at 13.6 per cent, from the validation section.
The method’s accuracy is therefore best where the flow is simplest and worst where it is most disturbed — which is the honest way round for a study whose conclusion concerns riders deep in disturbed flow.
The number
Every rider in the peloton had less drag than an isolated rider. In the mid rear of the bunch, drag fell to 5 to 10 per cent of an isolated rider’s at the same speed.
Reference That the drag of all cyclists in the peloton decreases relative to an isolated rider, and that in the mid rear it reduces to 5–10 per cent, from the abstract and the results.
Drag on a sheltered rider, as a share of an isolated rider's at the same speed
Per cent of an isolated rider's drag — lower is more sheltered
The numbers behind this chart
| Row | Per cent of an isolated rider's drag — lower is more sheltered | Detail |
|---|---|---|
| Isolated rider | 100 | the reference case, by definition |
| Small in-line group | 50 to 70 | the range previously reported and reproduced here |
| Mid rear of a peloton | 5 to 10 | this study’s result |
Source Blocken et al., Journal of Wind Engineering & Industrial Aerodynamics 179 (2018), 319–337.
Method Values as reported in the paper. The small-group figure is the range the authors cite from previous studies and reproduce for trailing riders in their own sub-configurations; the peloton figure is their result for the mid rear.
The authors translate that into a figure a rider might recognise: an equivalent cycling speed 4.5 to 3.2 times less than the peloton’s actual speed.
Reference The equivalent-cycling-speed factors of 4.5 to 3.2 times less than peloton speed, from the abstract.
That is not a marginal refinement of 50 to 70 per cent. It is a different order of magnitude, and it means that models of cycling performance built on the older figure were describing a rider in a short line, not a rider in a bunch.
Why a bunch is not a longer line
The authors give the mechanism, and it has two parts.
A rider in the mid rear of a densely packed peloton is sheltered by multiple rows in front, not by one wheel. And — the less obvious half — the many riders behind also help, through what the paper calls the subsonic upstream disturbance: the effect every object moving through still air has on the air ahead of it, which follows from the elliptic mathematical character of the governing equations for subsonic flow.
Reference The two contributions — shelter from multiple rows in front, and the aerodynamic benefit from riders behind through the subsonic upstream disturbance — from the discussion section.
Air ahead of a rider is already being pushed aside before that rider arrives. In a line of four, there is almost nobody behind to do that. In a bunch, there are dozens, and their combined upstream effect is part of why the interior of a peloton is so much cheaper than a queue.
The paper also notes that the very low figure matches what riders and cycling experts describe: that a cyclist in the belly of the peloton hardly has to pedal to move with it and has extremely low energy expenditure. Against a 50-to-70-per-cent model, that description reads as exaggeration. Against 5 to 10 per cent, it reads as a report.
Reference The authors’ observation that the low drag figures correspond to the experience described by professional cyclists and cycling experts, from the discussion section.
Why it matters at all
Aerodynamic drag is not one factor among many at racing speed. At about 54 km/h, or 15 m/s, the paper cites earlier work putting aerodynamic resistance at roughly 90 per cent of a rider’s total resistance.
Reference That at about 54 km/h aerodynamic resistance is around 90 per cent of total resistance, cited from earlier work in the paper’s introduction.
If nine-tenths of the problem is air, then reducing air resistance to a twentieth of its isolated value removes almost all of the problem. Position in the bunch stops being a tactical preference and becomes the single largest term in a rider’s energy budget — larger than equipment, larger than position on the bicycle, larger than anything a rider does with their legs.
What the study does not establish
The paper is unusually explicit about its own edges, and the limitations bear directly on how far the headline number travels.
The cyclists, in both the simulations and the wind tunnel, had static legs and fixed wheels. The authors address the second of those directly: a single additional simulation of an isolated cyclist with rotating wheels, on a 55.3-million-cell grid, produced 37.30 N of drag against 36.06 N with static wheels — which they read as indicating that wheel rotation is not a major factor, at least for an isolated rider.
Reference The static-leg and fixed-wheel limitation, the additional rotating-wheel simulation, its 55.3-million-cell grid, and the 36.06 N versus 37.30 N result, from the limitations section.
For the legs they cite earlier work finding that a pedalling cyclist’s drag, averaged over a revolution, is close to that of the same cyclist with the crank near horizontal.
Reference The citation of earlier work on the drag of a pedalling cyclist averaged over one pedalling revolution, from the limitations section.
Both are reasonable defences and neither is the same as having measured a pedalling peloton. Two other constraints follow from what a simulation is: the results describe specific formations at a specific speed in still air, so they do not tell you what happens in a crosswind, on a climb, or in a bunch that is changing shape — which is most of a bike race.
What survives all of that is the comparison, and the comparison is the finding. Whatever the exact percentage in any real bunch, the sheltering effect of a large peloton is far larger than the effect of a short line, and the difference is not a correction. It is the reason the peloton has the shape it does.
Read the evergreen pages
This piece is an argument. These are the reference pages on SocialSportHub that document the same subjects.
References
- [1]Journal of Wind Engineering & Industrial Aerodynamics (open access via Eindhoven University of Technology)Peer-reviewed. Aerodynamic drag in cycling pelotons: new insights by CFD simulation and wind tunnel testing — Blocken, van Druenen, Toparlar, Malizia, Mannion, Andrianne, Marchal, Maas and Diepens, volume 179, 2018, pages 319–337. Accessed 6 September 2026.
Continue reading
Editor’s pick
The UCI does not regulate the bicycle for speed. It says so
Cycling's technical regulation is usually read as a fight over marginal gains. Read the governing body's own clarification guide instead and a different rulebook appears — one that regulates the shape of a bicycle to preserve an idea of what a bicycle is, and states that purpose in writing.
Editor’s pick
Every 250-metre velodrome is a different 250 metres
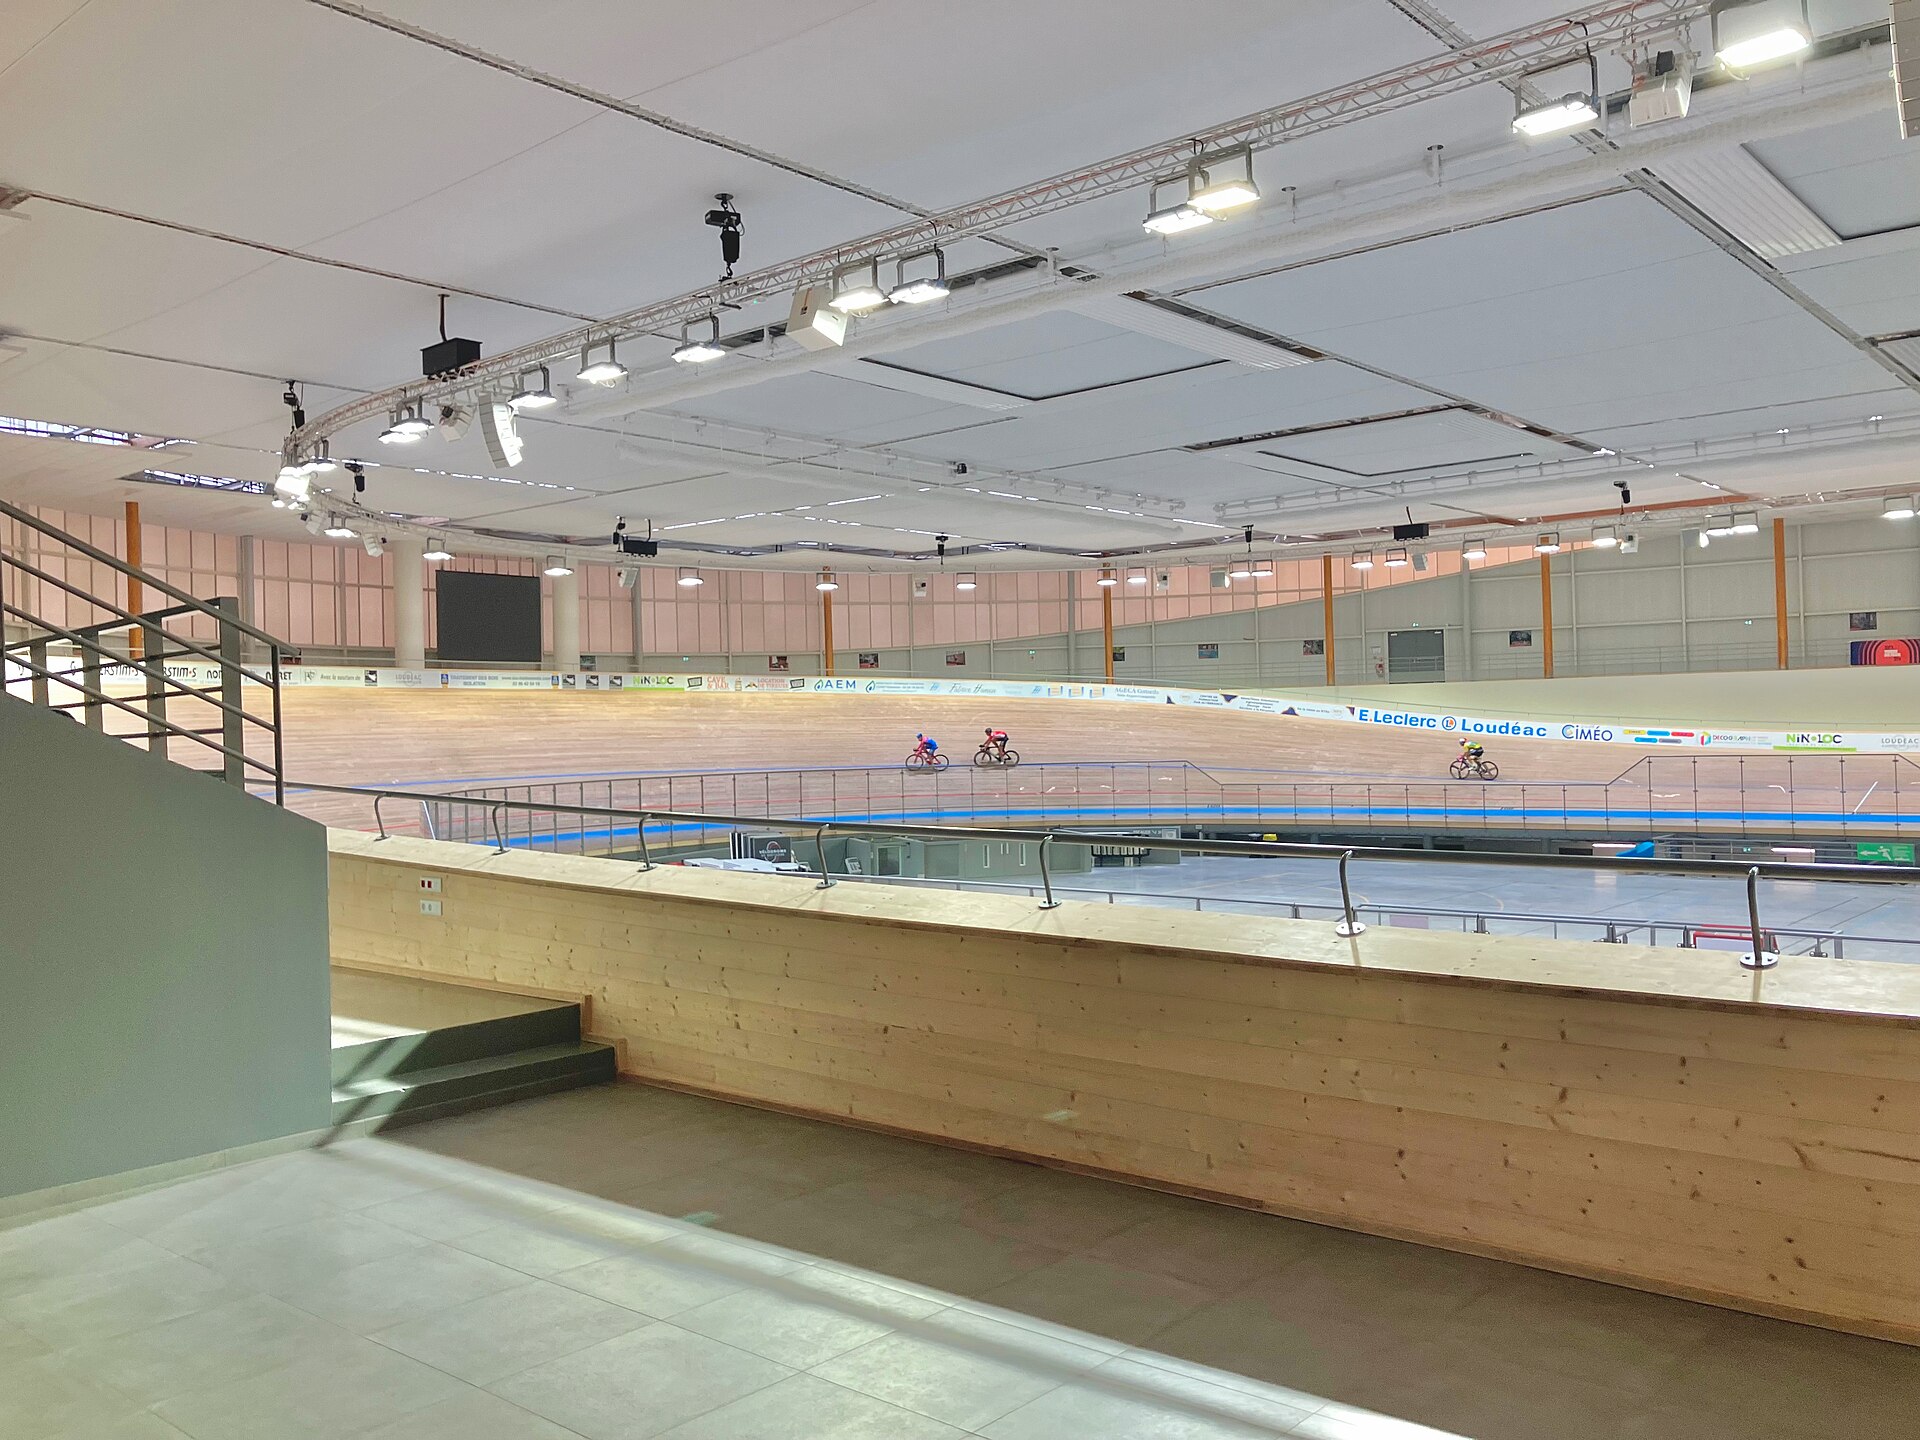
The UCI fixes a track's length, its width, the position of three painted lines and the requirement that any cross-section be straight. It does not fix the banking, does not require the four quadrants to match, and the resulting geometry is often withheld as commercially confidential.
More on cycling
Cycling's sock rule is measured against two bones
The UCI limits how high a sock may rise, and it does not use centimetres. The limit is half the distance between the middle of the lateral malleolus and the middle of the fibula head — a rule stated in anatomy, for a stated reason.